Console tour
The console's main sections map onto the four building blocks: Data Sets contain things, Resources is the graph of those things, Time Series and Events are what they produce, and Files is what documents them. Two more blocks, policies and functions, are recorded in the model today, with enforcement and execution on the roadmap. Together, these sections are the anatomy of a digital twin.
The home dashboard
Signing in lands you on a dashboard that answers "what is in here, and what has been happening":
- Headline counts, root assets, all assets, series, datapoints, events, alarms, data sets and policies. A quick sanity check that ingestion is alive.
- Top event types, what has been happening most across your operation.
- Time series spotlight, a chart of a recent series, with a marker if nothing has arrived in 24 hours.
- Recent activity, the latest events.
- Jump back in, tiles straight into assets, series, events and data sets.
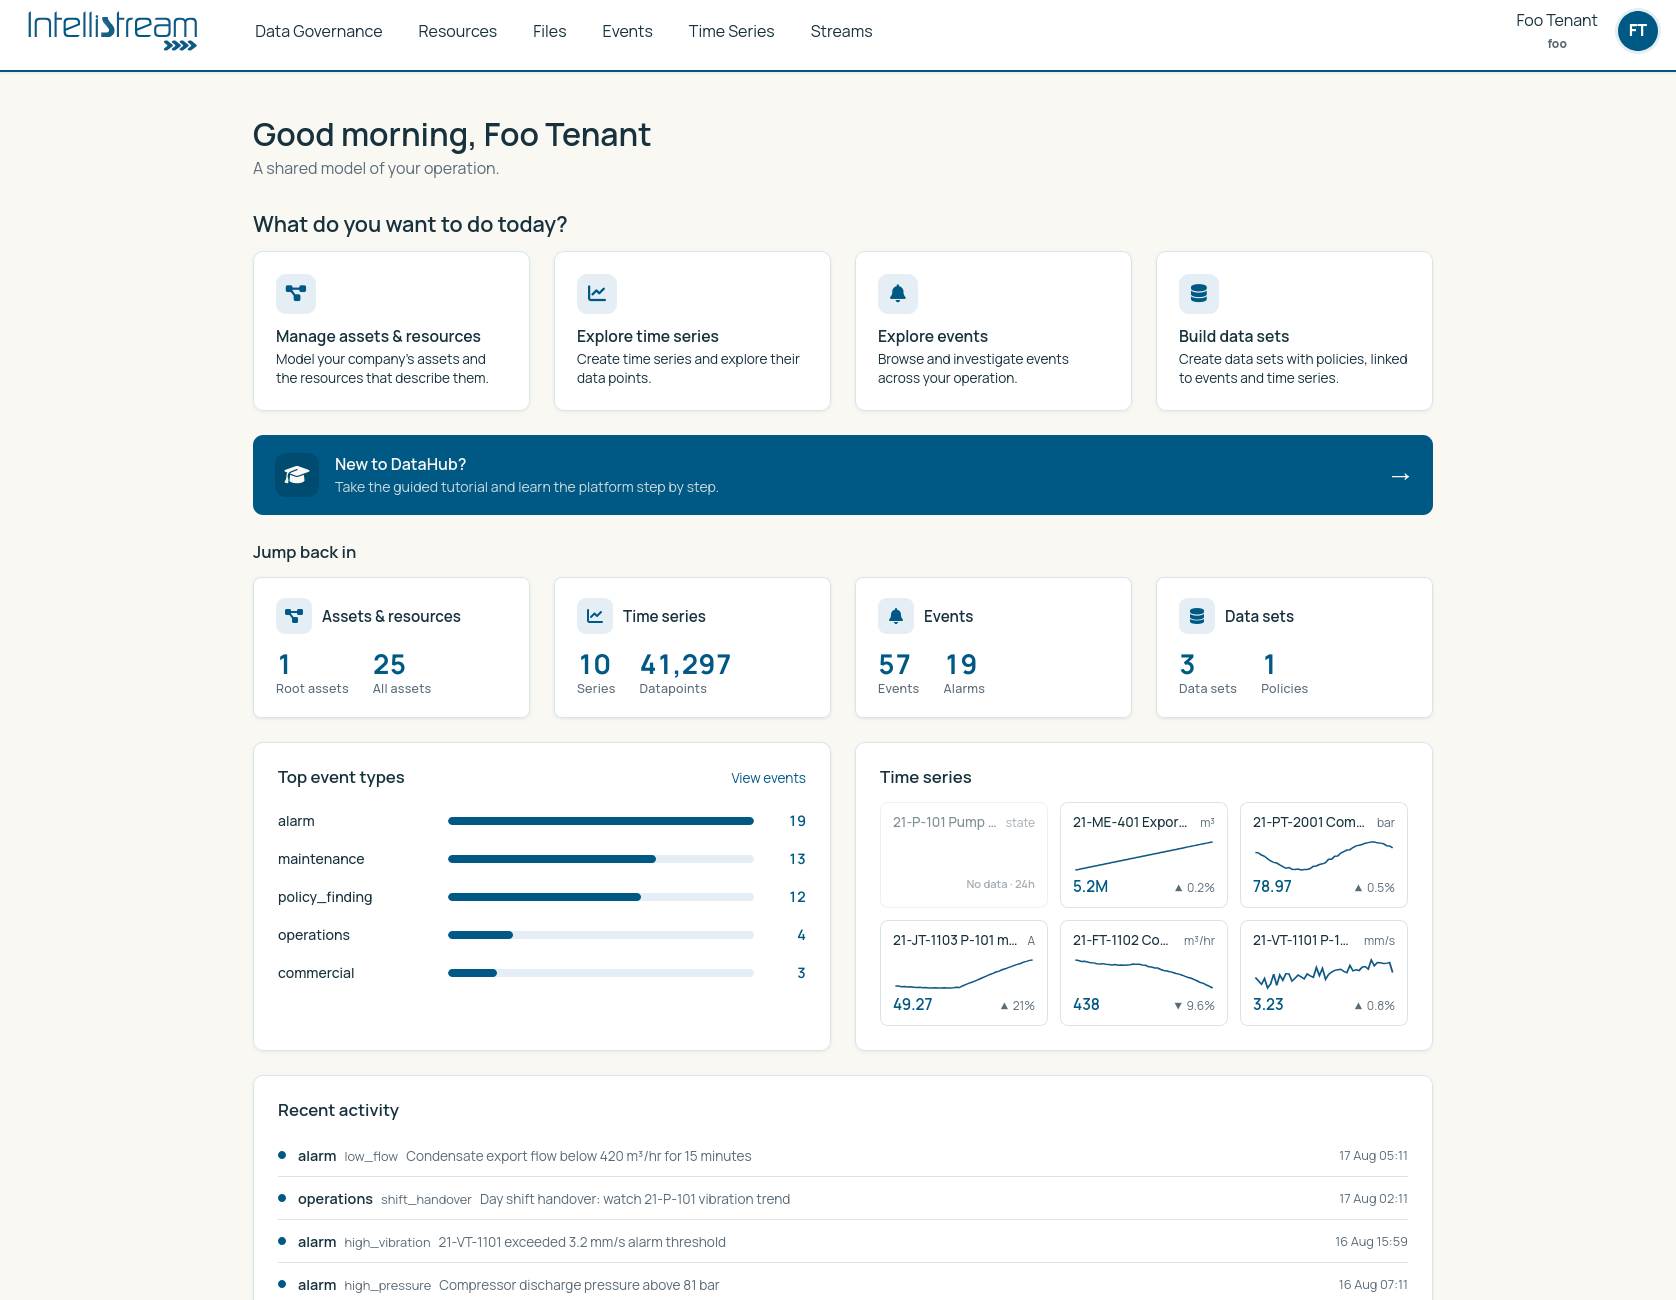
On an empty installation the tiles become an invitation instead: manage assets and resources, explore time series, explore events, build data sets, plus the guided tutorial for anyone new. Your first hour →
The main sections
Data sets, the containers that group related data and control who can read or write it, on the section's first tab. Access policies and their findings live alongside them.
Your model, drawn as a network graph. Create assets, connect them with relationships, label them, and trace dependencies.
The measurements. Create series, set units and value types, search, and open them in Insights to chart and compare.
The event log, every alarm, job and state change, filterable by type, time and asset, each one tied back to the resources it concerns.
Documents and images attached to your model: P&IDs, datasheets, inspection photos. Folders and a recoverable trash for deleted files.
Charting: one series over time, several compared on one axis, and a Live mode that streams readings as they arrive.
Change data capture, connecting a source database directly so its changes flow in automatically. Lives under the console's Streams area; mostly for administrators.
The Streams entry in the main navigation opens those change-data-capture integrations and holds nothing else. Live data itself is consumed through data subscriptions, which are created by whoever builds against the platform rather than on a console screen; the Time Series section shows which subscriptions a series belongs to.
Things in the top bar
Ask AI is a button in the bar itself. Everything else below sits in the menu under your name and organisation at the right-hand end.
| Ask AI | Opens the console assistant, a chat panel that answers from your own data and can hand you a button to the screen it looked something up on. Read-only, and only present where your deployment, your tenant and your role all allow it. The console assistant → |
| Guided tutorial | An in-console walkthrough that builds a small model with you, adapted to your industry, oil and gas, energy, manufacturing, or tech/IoT. It can be resumed, restarted, or jumped into by chapter. The guided tutorial → |
| Copy token | Copies your access token, for sending data in from a script or an integration. Treat it like a password. |
| Light / dark mode | Switches the console theme. |
| About DataHub | The version and build time, the licence, links to the source code and this documentation, and the facts worth quoting when you report a problem: who is signed in, which organisation, and which API the console is talking to. |
| Language | English and Norwegian Bokmål. The language follows a ?lang= setting in the address rather than a menu control. |
| Logout | Ends the session. Sessions also end automatically after a period of inactivity. |
Patterns that repeat everywhere
Learning these four once saves reading the rest of this section closely.
Search and filter
Most list views, resources, time series, files, have a search box and a filter panel. Searches are on name and external id; filters narrow by label, data set, time range or type depending on the section. Where a Clear filters control exists it resets everything, which is worth remembering when a list looks unexpectedly empty; on the events list, clear the filter fields themselves.
The naming help icon
Next to the name, external id and label fields on every create form there is a help icon. It opens the conventions for naming that kind of thing, including examples and the industrial standards they follow. It is the same guidance as Naming and standards, placed where naming actually happens.
Relations are set on the form
Most create forms have a relation field with a + button: pick the resource to connect to and the relationship type. This is how a new time series, file or resource joins the graph. A resource with no relationships is invisible to traversal, so the field is not optional in spirit even when it is in form.
Metadata is free-form
Resources, series and events all accept metadata, arbitrary key/value pairs. Use it for anything you will later want to search, filter or group by, without needing a schema change: manufacturer, install date, criticality, owner, calibration due. It is the right home for everything that must not be encoded in an external id.
What you can see depends on your permissions
Lists silently omit data you do not have read access to. If a colleague can see a series and you cannot, that is a data set permission, not a bug, the list is filtered rather than showing an error.
Write actions behave differently: attempting one without permission returns an explicit "forbidden" message naming the data set. How permissions work →
- Guided tutorial: the console walking you through it, chapter by chapter
- Your first hour: build something in the console, step by step
- Data sets: the container everything lives in
- The resource graph: the heart of the console
- Administration overview: for the sections aimed at administrators