The resource graph
The Resources section is where your model lives. Resources are the things in your operation; the lines between them are named relationships; and the whole thing is drawn as a navigable network.
This is the most important screen in the console, everything else hangs off what you build here. The graph you build is the structure of your digital twin, the layer everything else is grown from.
What can be a resource?
Anything your operation refers to by name. The word suggests equipment, and equipment is usually where a model starts, but the graph makes no such distinction, and the non-physical kinds are where much of the value hides:
| Kind | Examples | Why it earns a place in the graph |
|---|---|---|
| Physical things | Pumps, vessels, lines, sites, vehicles, instruments | The usual starting point |
| Structural things | Data sets, policies, functions | The platform's own building blocks are resources too, in the same graph |
| Work and knowledge | Work procedures, operating instructions, documentation | A procedure linked to the equipment it governs is findable from that equipment, instead of from whoever remembers the folder |
| Risk and safety | Risks, mitigations, barriers, safety cases | "Which risks does this pump carry, and which mitigations control them?" becomes a traversal instead of a workshop |
| Business concepts | KPIs, targets, obligations, contracts, cost centres | The top layer that connects data to decisions |
The risk row deserves a sentence more, because it surprises people. Model a Risk connected
to the equipment it concerns, and a Mitigation connected to the risk it controls, and
barrier thinking becomes something you can query: a failed
mitigation lights up every risk
it was holding, and every asset those risks sit on. That is the same traversal machinery as
everything else on this page, applied to safety instead of telemetry.
One habit keeps this powerful rather than messy: give each kind its own
label, so Risk and Procedure are queryable populations, not
miscellaneous nodes.
Creating a resource
Every resource needs three things. Why these three →
What a person reads in a list. Lead with the plant tag if the facility has one:
21-PT-1234 Separator inlet pressure. Changeable at any time.
The permanent handle integrations match on. The form suggests one derived from the
name, in lowercase with underscores, and that is only a suggestion: type your own and it
is stored exactly as written, so COM-99-PT-1034 stays COM-99-PT-1034. Override the
suggestion when the derived value would encode something unstable, and whenever the
facility already has a tag for this thing.
It must never change and never be reused.
What an external id may contain →
The class it belongs to, Pump, Separator, Site. Click + to pick an existing
label or create a new one. A resource with no label cannot be saved.
Optionally also:
- Metadata, free key/value context: location, owner, calibration date, criticality. Anything you will later want to search, filter or group by.
- Source, where this resource came from, useful when several systems feed the model.
- Data set, which container it belongs to and therefore who can see it. The form suggests one, the data set of the resource you are creating from, or failing that the one you used last, and you can change it. Leaving it empty creates a resource outside every data set, which only somebody with the all-data-sets write grant may do, so for most people the field is effectively required.
The naming help icon beside these fields opens the full conventions, including how they map onto your facility's tagging standard. Naming and standards →
If an administrator has set a naming policy, it is checked as you save. The create then either goes through, goes through with a warning that lands in a data steward's queue, or is refused with the reason and a suggested id. An id that differs from an existing one only by case, or only by which separator it uses, is refused as a duplicate.
Root resources and building outward
A root resource is one with no parent, typically a site, a plant, or the top of a network. Root resources are the entry points into your graph, and the resource list shows them first.
From any node you have two ways to grow:
- Create resource with relation, creates a new resource and connects it in one step. This is the normal way to build out a model, because it makes it impossible to forget the relationship.
- Create relationship, connects two resources that both already exist.
You can also clone a resource, which copies its labels and relationships as a starting point (metadata is not copied). That is the fast path for a row of near-identical equipment: model the first pump properly, clone it for the rest, adjust names and ids.
DataHub refuses a delete that would leave a resource disconnected from the graph root. The request is rejected with an error naming the resources that would be stranded: delete them together, or keep a connecting path. (The console's confirmation dialog still warns that a node "will be deleted"; it will not be, the delete is simply refused.)
Labels
Labels are your taxonomy. They classify a resource and colour its node in the graph, which is what keeps a model with thousands of nodes readable at a glance.
- Create labels deliberately, in the singular, spaces between words:
Pump,Control Valve. Names are stored upper-cased with underscores (CONTROL_VALVE). - Give each one a colour that makes sense at a glance, one colour family per layer of the model works well.
- Labels can carry a language code so the console can display them translated.
- The type label is singular: a resource carries at most one type, fixed at creation,
encoding what it
fundamentally is. Other labels can be added and changed freely, which makes them good for
cross-cutting tags such as
SafetyCritical.
Label names must be unique, and a label in use cannot be deleted, which is a feature, not an obstacle.
Relationships
The relationship is the name on the line between two resources: contains, feeds, monitors, powers, contributes to.
Two things to get right, both covered in naming and standards:
- Name what is actually asserted. related to carries no information and makes traversal useless.
- Fix the direction and hold it. Monitors and is monitored by are different facts. Decide the convention once and apply it consistently.
When editing a relationship you can also enable animate data flow and give it a data type,
for example temperature. The data type then travels visually along that relationship in
the graph, from source node to target node, which makes a flow legible without reading
labels.
Two relationships are constrained, because data sets are the access boundary:
- A relation to a data set must be belongs to, the relationship the data set hierarchy and membership are built from. The form picks it for you whenever the starting resource is a data set, and nothing else is accepted, whichever way the relation is made.
- A time series belongs to one data set. Connecting a data set to a time series that already sits in another one is rejected with an error saying so.
Using the network view
The graph is for exploring and explaining. Selecting a node raises a small toolbar above it; that toolbar, plus the two controls in the sub-nav, is the whole set:
| Control | What it does |
|---|---|
| Click a node | Centres the view on it and shows what it connects to |
| Expand relations | On the node's toolbar. Pulls that node's neighbours into view, and hides them again on a second click |
| Add a connected node | The + on a node creates a resource already connected to it. On a data set it first asks what to add: a resource, a time series, a sub-data set or a policy |
| Create relation to | Connects this node to another that already exists |
| Edit and Clone | Change a node, or copy its labels and relationships as the starting point for the next one |
| Stabilise network layout | Freezes a dense area that will not settle |
| Filters | Narrows the graph by label, relationship type or name, essential above a few hundred nodes |
Expanding is how you follow a dependency chain. Start at the symptom, pull in its neighbours, and step outward a hop at a time. It answers "which assets does this sensor feed?" and "what would a change here ripple into?" without anybody writing a query, and because each hop is a deliberate click you can see where the chain widens.
Filtering is how you isolate one. Unchecking every relationship type except the one that carries flow leaves the process route lit and fades the containment hierarchy, which is what makes a large graph readable. Labels work the same way: tag the resources along a route with a cross-cutting label, filter to it, and only that route stays bright. Filtered elements are dimmed rather than removed, so the surrounding shape stays as context.
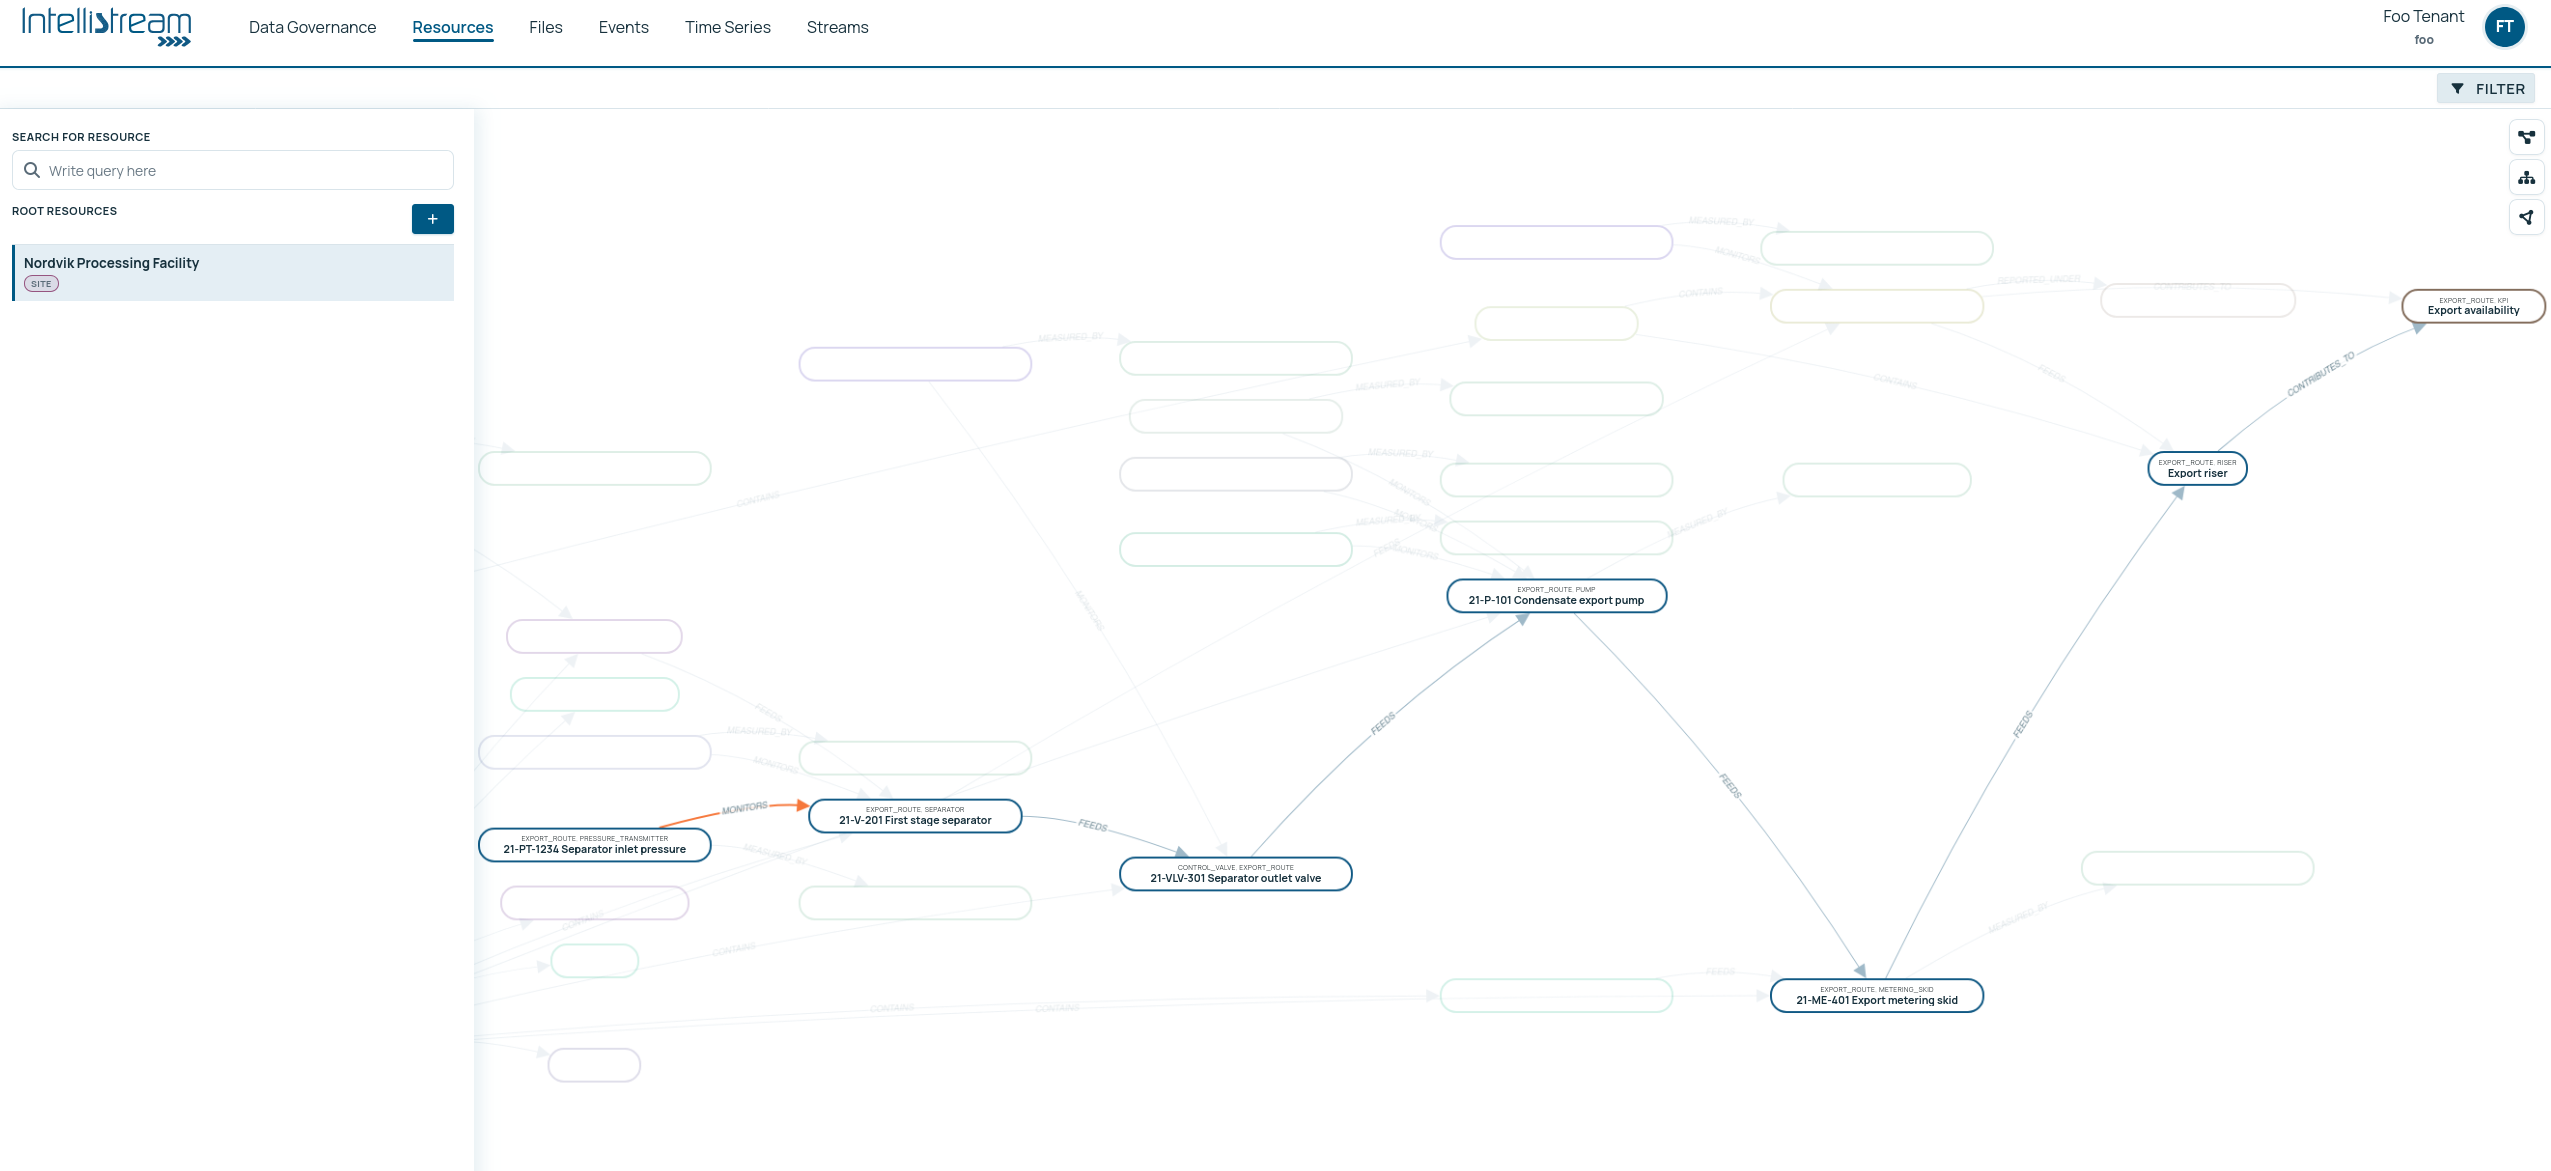
Both of these follow structure, what connects to what. Tracing a number back through the computations that produced it is lineage, a separate and planned capability.
Tracing a route in one action is on the roadmap. Today you follow a chain by expanding node by node, and isolate one by filtering. What is coming is the single gesture: select a node, and everything not on the path dims, so one dependency chain stands out without setting a filter up first. The graph already dims rather than hides, so this is the same picture reached in one step instead of three.
Browsing one system at a time is planned. Operators think in process systems, cooling, gas, produced water, and the network view cannot yet slice the graph along those lines and show one system on its own. The model can already carry the segmentation, a system can be a resource and membership a relationship, or simply a label, so what you build now is what that view will eventually open on.
Editing and deleting
Editing a resource lets you change its name, labels, metadata, data set and relationships. The external id should never change, and the naming help says so, but this is guidance rather than enforcement: both the API and the edit form will change it if you insist. Treat it as immutable anyway, because integrations match on it and a change breaks them silently. What the form actually locks is the type label, which is fixed at creation.
Deleting warns you when it would orphan a connected resource. Both endpoints of a relationship are checked, so you find out before rather than after.
Moving a model between tenants
A model built in one tenant can be carried into another as a single file: from a test tenant into production, from one site to a sister site with the same structure, or out of the platform as a copy of the structure itself. Right-click a root resource in the resource list and choose Export graph. Everything connected to that root, however many hops away, goes into one file: every resource with its name, labels, metadata, description, data set and location, and every relationship between them. The file is named after the root's external id.
Import graph, on the same menu, reads such a file into the current tenant. It creates what is missing and leaves alone what is already there, matched on external id, so importing a file into the tenant it came from changes nothing, and importing the same file twice is harmless. When it finishes, the page reloads and a message says how many resources and relationships were created and how many were skipped.
Three things to know before relying on it:
- Time series are not carried. The file has no room for a series' unit and value type, so any series in the exported model are listed as skipped, together with the relationships that touch them. Create the series in the target tenant first, then import the same file again, and the relationships to them are added.
- The file holds the whole connected graph, including resources in data sets the person exporting could not open directly, because traversal is gated on the starting node only. Treat an exported file as you would treat the data in it.
- Importing needs the same permissions as creating by hand: write access to every data set the imported resources land in, and the all-data-sets grant for resources that arrive without one and for any data sets in the file. A refusal stops the import where it has got to; what was already written stays, and a second import continues from there.
A file may hold up to two million resources and two million relationships. The platform's ordinary limit on request size applies to the upload as well, and a default installation sets that at a few megabytes, so an administrator raises it deployment-wide before a large model is moved. Limits and quotas →
Where resources come from at scale
Creating resources by hand is right for modelling sessions and for the top layers of the model. At volume, thousands of instruments, a full equipment register, resources are imported through the API or a change-data-capture integration.
An import is all or nothing. Every external id in the batch is checked before anything is written, so if one item in five hundred breaks the naming policy nothing at all is created, and the error lists every offending id rather than stopping at the first. Fix them together and send the batch again.
The model you build by hand is what the import lands into: your labels and relationship types are the target structure. Linking each imported record to the thing it describes is contextualization, and it is the work that decides whether an import produces a model or a pile. Build the shape first with a few dozen hand-made resources, prove it works, then import. Building your model → · Change data capture →
Where agents help
An agent can create and update resources through the same API and MCP tools you use here, which makes it useful for the two jobs that are tedious by hand: bulk creation from a source system, and finding the duplicates that appear when the same pump was created twice under two spellings.
It is also the fastest reader of this screen you will ever have. Asked what a piece of equipment affects, an agent walks outward from it and answers in one step, where a person clicks through the graph.
- Using MCP: how an assistant walks outward from a resource to its neighbourhood
- Knowledge graphs: what the graph makes possible
- Naming and standards: conventions for names, labels and relationships
- Building your model: the workshops that decide what to create
- Time series: attaching measurements to these resources