Time series
A time series is one signal, measured repeatedly, a stream of timestamped values from a single instrument, or from a function that computes one. Connected series are the senses of a digital twin, the layer that keeps the model in step with the plant.
Two decisions matter when you create one: the unit and the value type. The value type is fixed forever at creation, so it is worth thirty seconds of thought.
Creating a series
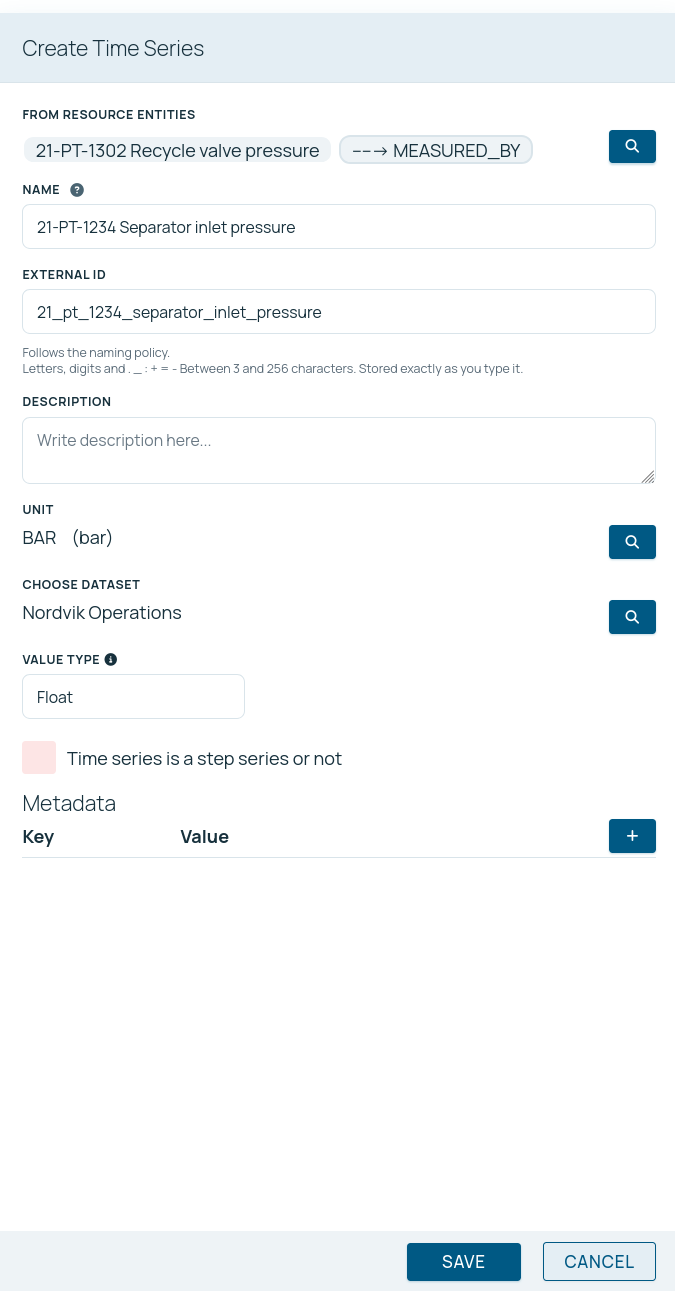
One series per measurement. Name it after the instrument loop where one exists:
21-PT-1234 Separator inlet pressure. The external id fills in automatically.
Leave the unit, the value type and any time range out of the name, they all have their own fields.
Click + to choose: bar, °C, kWh. The unit is what makes a number readable and comparable across series, and picking one lets DataHub suggest the most storage-efficient value type for it.
How each reading is stored. See the table below, this is the one that cannot be changed later.
A step series holds its value until the next reading (a set-point, a mode, a state). A non-step series is interpolated between readings (a continuous physical measurement). This affects how charts and aggregates read the gaps between samples.
Click + on the relation field, pick the resource this series measures and a relationship. Do not skip this. An unconnected series is a column of numbers; a connected one is a property of a real thing. The linking step is contextualization, and it is what makes the series part of the model rather than beside it.
Which container it belongs to, and therefore who can read and write it.
Value types
The value type sets how each datapoint is stored, its size, precision and compression. It is fixed when the series is created and cannot be changed later, so pick the most compact type that still represents your data honestly.
| Value type | Use it for | Notes |
|---|---|---|
| Big Integer | Counters and tallies, whole numbers, no decimals | Most compact for integer values |
| Float | Analogue measurements | 64-bit floating point. Fast to aggregate, with tiny rounding |
| Float (32-bit) | Analogue values where about 7 significant digits is enough | Half the storage of Float |
| Decimal (compact) | Small-range readings like temperature or percent | Exact to 4 decimal places, very compact |
| Numeric | Values that must be exact, billing, finance | Exact to 6 decimal places, large range |
| Text | States, labels, modes, non-numeric readings | Arbitrary text |
| Mixed (number or text) | Sensors that publish text statuses alongside numeric readings | Handles a FAULT string in a float series |
Two practical notes:
- Mixed exists for a real reason. Many industrial sensors publish
FAULT,NODATAor similar strings in the same stream as their measurements. Without Mixed, those readings either break ingestion or get silently dropped, both worse than storing them. - Storage matters at scale. Choosing Float (32-bit) over Float across a million-series estate halves the storage bill for that data with no practical loss for most analogue measurements. Choosing Numeric where Float would do costs several times as much.
The console shows this guidance behind the help icon next to the value-type field, so nobody has to remember it.
How often should you sample?
A question every new series raises, and one with a real answer from signal theory rather than a matter of taste.
The rule is the Nyquist–Shannon sampling theorem: to capture a signal faithfully, you must sample at more than twice the highest frequency you care about. Sample slower than that and fast behaviour does not just blur, it disguises itself as slow behaviour, an effect called aliasing. It is the same illusion that makes wheels appear to spin backwards on film: the camera samples too slowly for the rotation, so the motion reads as something it is not. An aliased sensor reading looks perfectly plausible on a chart, which is exactly what makes it dangerous.
Putting it to work:
Not the fastest the instrument can measure, the fastest dynamics that matter to the question. A tank level drifts over minutes; a pressure surge lives in seconds; pump vibration lives in milliseconds.
Twice is the theoretical floor. Engineers normally use five to ten times the frequency of interest, so the shape of the behaviour survives, not just its existence.
Storage grows with datapoint rate, and today measurement history is kept indefinitely, so an over-sampled series costs money forever. Why rate dominates the bill →
The practical rule of thumb per signal: fast enough that the behaviour you care about cannot hide, and no faster. A slow drift sampled every second is money wasted; a surge sampled every minute is a surge you will never see, or worse, will misread as a trend.
Finding series
The time series section has a dedicated search, and a filter panel to narrow by name, external id, unit, data set or the resource a series is attached to. Above a few thousand series, filtering by the resource is usually the fastest route, you know which equipment you care about, so start there and see what it emits.
To browse by data set instead, use the Time series tab of the data set section: click a data set and you get every series in it, including those of its sub-data sets. Seeing the time series in a data set →
Getting data in
A series is empty until data flows in. Datapoints arrive three ways:
- From your systems, through the API. The normal production path. Your integration team writes to the API, or uses the SDK for Java, Python or Rust. Developer documentation →
- From a change-data-capture integration. For source systems whose database can be tailed directly. Change data capture →
- By hand, for testing. Your integration team can send a few test readings with your access token, copied from the user menu at the top right.
Whichever route, the token is a credential, treat it like a password, and prefer a dedicated service account for production ingestion rather than a person's token. Users and access →
Editing a series
Name, unit, metadata, relationships and data set can all be changed after creation. The value type cannot: it defines the physical storage of every datapoint already written. The external id should be treated the same way, although the platform does not enforce it: integrations match on it, and a change breaks them silently. Why →
If a value type turns out to be wrong, the fix is to create a new series with the right type and migrate. That is deliberately a little painful, which is the point of choosing carefully at creation.
What to do with a series once it exists
The Insights view: quick time ranges, several series on one axis, and a live mode that streams new readings as they arrive.
Rank other series by how strongly they move with this one, including which leads which.
See what was happening to the equipment when the signal did something interesting. Drawing them onto the chart is on the roadmap; today, filter the event log to the same window.
Have new datapoints pushed to a person, a system or an agent the moment they arrive.
Where agents help
Two standing jobs live here, and both are covered in depth elsewhere. An agent can watch series continuously for the defects that do not announce themselves, a frozen sensor or a slow drift, and raise them rather than silently correcting. Data cleaning →
It can also compute new series: a derived value that means more than any raw signal, tested against what actually happened and written back where everyone can use it. Feature extraction →
-
Using MCP: the tools that let an assistant read history and latest values for you
-
Data cleaning: the five defects worth watching for, and why a correction is a new series
-
The four building blocks: where time series sit among the concepts
-
Functions: the computations that consume and produce series, on the roadmap
-
Insights: charting, comparison and live streaming
-
Relationship analysis: discovering which signals move together
-
Data lifecycle: retention and what it costs to keep data